Effective Communication Strategies for Ph.D. Research Presentations

Experienced mentors often find that Ph.D. students struggle with tailoring their research presentations to a diverse audience. Deeply immersed in their research, students frequently overestimate audience familiarity with the subject matter. Thomas Stewart, an associate professor of data science and the Ph.D. program director, shares his advice for enhancing clarity and impact for Ph.D. research presentations.
"In my experience, Ph.D. students can struggle with tailoring their presentation to the audience," Stewart says. "They spend so much time in the nitty-gritty details of their work. They struggle to reset their expectations for how much the audience will be familiar with the topic and relevant details." This discrepancy can lead to presentations that are either too detailed or too vague, making it difficult for the audience to grasp the key points.
The guidance provided to Ph.D. students preparing for research presentations is crucial for ensuring their work is effectively communicated. A poster worksheet (available below), utilized during practice sessions, can serve as a key tool in this preparation. This worksheet, comprising questions related to audience, message, impact, and clarity, is instrumental in honing the students' presentation skills.
To address this, the message and impact sections of the worksheet are designed to help students focus on what truly matters to the audience. Students may be inclined to present their findings chronologically, detailing each step of their research journey.
"Because students arrive at their results taking steps A, B, C, D, there is a temptation to present the results as a travel log, saying we did A then B then C, etc.," Stewart explains. "The truth is that the audience doesn’t care about the journey."
The audience is typically more interested in understanding the main message and the impact of the research. Therefore, students are encouraged to design their posters and presentations with these elements as the focal points.
The worksheet also includes an exercise in focus. Stewart asks students to go through each section of the poster or paragraph of the talk and to identify how it communicates the main message or impact. "If there isn’t a direct link to the message or impact, I encourage them to delete it. A very common mistake is to cram too much material into too little time or space. It is hard for students to edit in this way, but it is a helpful exercise."
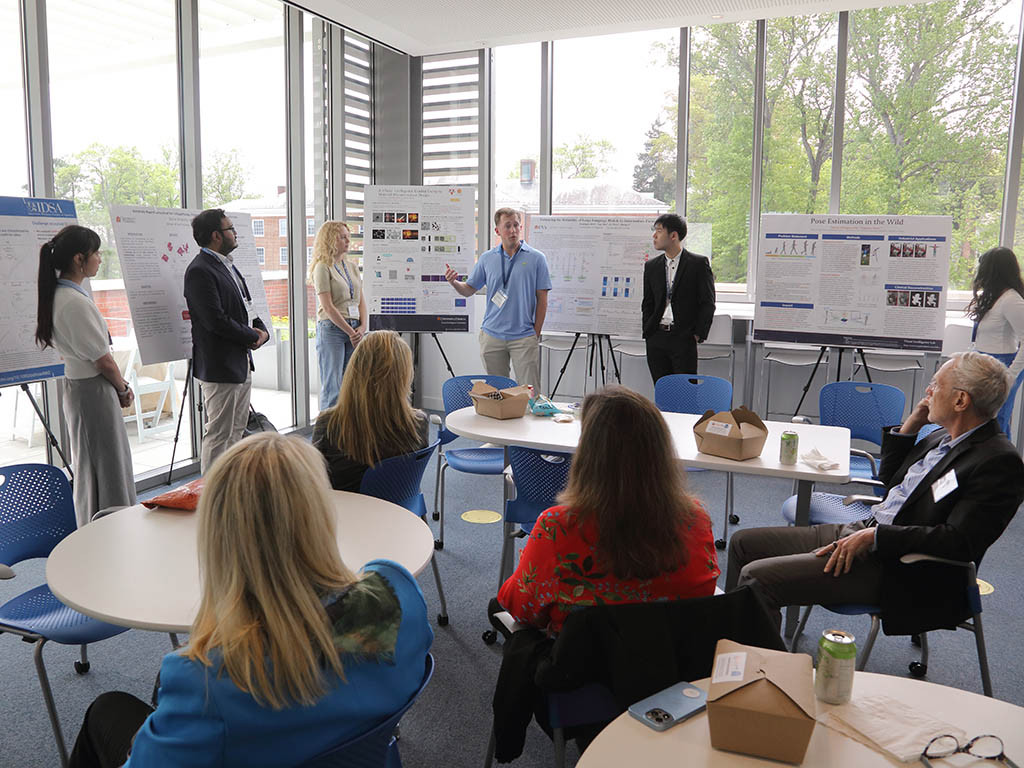
A peer review session constitutes the second page of the worksheet. "After showing a poster for 15 to 20 seconds, I blank the screen and ask the students to answer the questions on the second page," Stewart says. This exercise simulates the audience's initial reaction, providing valuable feedback on the clarity and effectiveness of the presentation.
Additionally, students practice delivering a concise two-sentence introduction, prompted by an audience member's inquiry: “Hey, tell me about your poster.” This practice is essential, as students often find themselves unprepared for such impromptu interactions. By rehearsing this introduction and focusing on how the research impacts the audience's life, students can significantly improve their communication skills.
Stewart recalls a particularly effective introduction honed after many attempts. "My favorite intro after several iterations was from a student who said, 'Hi, my name is Joseph, and I use deep learning to make better bombs.'"
Students frequently inquire about presenting to mixed audiences of experts and the general public. To navigate this challenge, they are advised to use the “to-X-we-did-Y” strategy.
Stewart shares an example: "To understand the nonlinear relationship between patient age and risk of mortality (X), age was added to the regression model as restricted cubic splines using 5 knots (Y)." This approach involves prefacing technical details with a high-level explanation of their purpose, ensuring that both technical and non-technical audience members remain engaged.
These structured exercises and strategies help Ph.D. students craft presentations that are not only informative but also engaging and accessible to a diverse audience.


